BT analysis: the two numbers that show how much Romania has narrowed the gap with the European Union

In its 20 years in the European Union, Romania has closed a significant part of the development gap with European economies. This transformation is visible both in the size of the economy and in everyday life, from what we buy to the services we use.
Two figures capture this transformation best. They refer to GDP per capita, adjusted for purchasing power (Purchasing Power Standard, PPS) and to actual individual consumption. The first shows how much the economy produces, relative to the population and price levels. The second brings us closer to everyday life and shows the goods and services people benefit from and consume. Viewed together, the two figures provide a picture of economic progress and how it translates into living standards.
According to Eurostat, Romania reached the following in 2025:
- 78% of the European Union average for GDP per capita, adjusted for purchasing power (PPS);
- 86% of the EU average for actual individual consumption.
GDP per capita, adjusted for purchasing power: from 44% to 78% of the EU average
- GDP shows how much an economy produces in a year. Looking at it per capita lets us compare countries of different sizes, and adjusting for purchasing power accounts for the fact that 100 euros does not buy the same basket of goods and services in Bucharest, Rome or Paris.
- 78% of the EU average does not mean a Romanian salary is 78% of the European average, because GDP covers the whole of economic activity, not just household incomes. The percentage indicates the average level of development of Romania’s economy relative to the EU average and should be viewed alongside other indicators such as incomes, consumption and access to services.
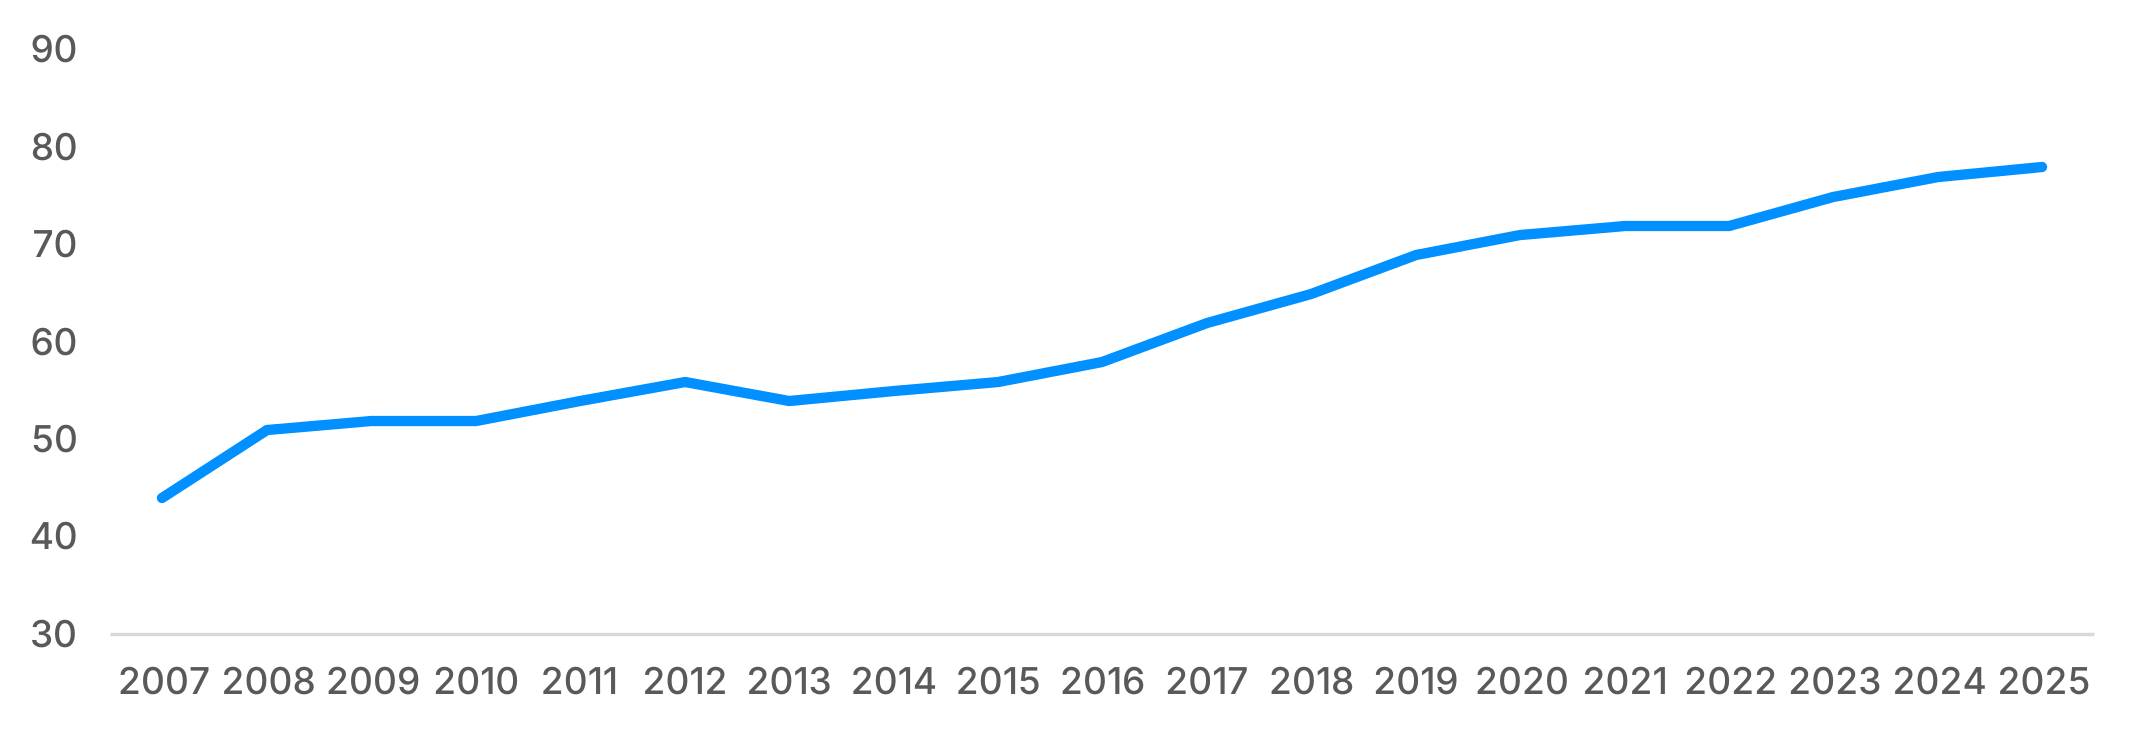
In 2007, the year Romania joined the European Union, Romania’s GDP per capita adjusted for purchasing power (PPS) stood at about 44% of the EU average, and by 2025 Romania reached 78%. That is a catch-up of 34 percentage points, placing the country alongside peers in the region: Poland is at 81%, Hungary at 76% and Slovakia at 75%.
Evolution of GDP per capita, adjusted for purchasing power (PPS)
Romania, 2007 – 2025
Actual individual consumption: closer to the European average, at 86%
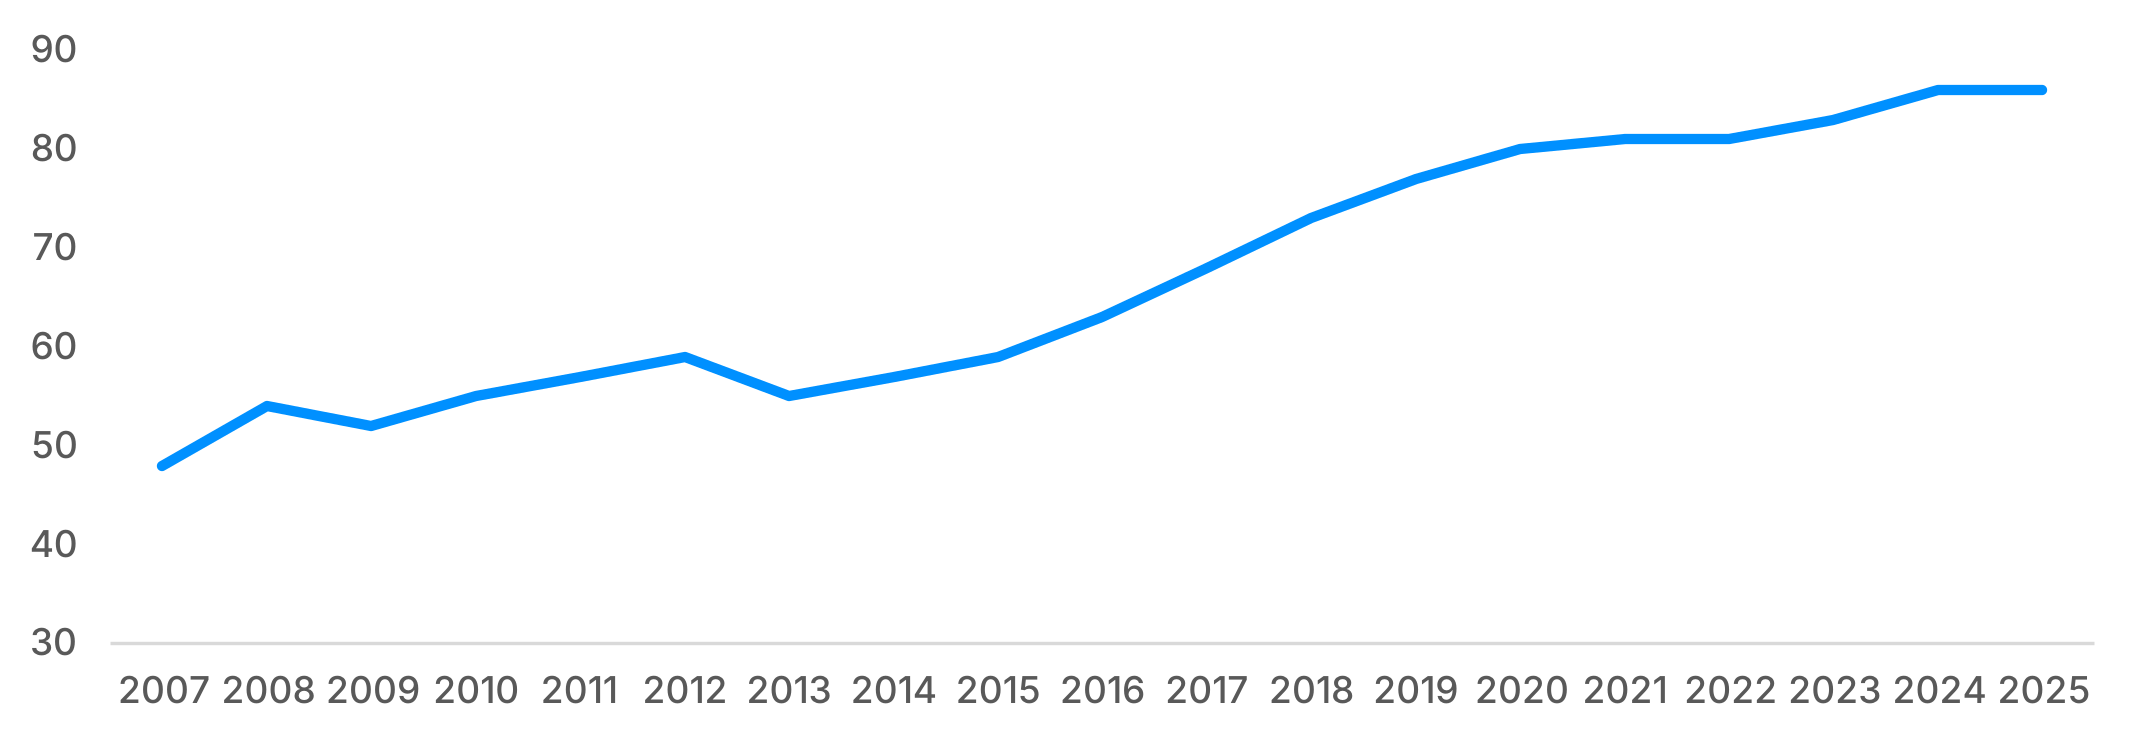
Actual individual consumption shows how economic development is reflected in day-to-day life. This indicator includes the goods and services people benefit from, whether paid out of pocket or provided through public services and non-profit organisations. In 2025, actual individual consumption per capita in Romania, adjusted for purchasing power (PPS), reached approximately 86% of the EU average.
Evolution of actual individual consumption, PPS
Romania, 2007 – 2025
When we live through changes day by day, it’s harder to see their scale. But if we compare Romania 20 years ago with Romania today, the difference is substantial. Moving from 44% to 78% of the European average shows how much the Romanian economy has caught up, while actual individual consumption at 86% of the EU average shows that a large part of this convergence is visible in the goods and services people benefit from and consume. To sustain growth, we need to turn investment into productivity, productivity into higher incomes, and economic growth into opportunities for as many Romanians as possible.”
Ioan Nistor, Chief Economist at Banca Transilvania and author of the analysis.

10 BT analyses for Romania’s 20 years in the EU
On January 1, 2027, Romania marks 20 years since joining the European Union. Banca Transilvania has launched a series of weekly analyses on Romania’s evolution over the past two decades, the first of which was about Betting on Romania, 20 years after joining the EU.